How Multi Year Crop Trend Analysis Can Help Your Profitability
A Brief Introduction
Less than a year ago, we took the hard path to create a comprehensive platform that delivers accurate, rich and timely agricultural intelligence, globally. In just under 4 months, we developed our initial product that identifies crops country-wide and published our demo at app.agcurate.com You can read more on our story here.
Our platform is powered by various satellite imagery sources and proprietary machine learning algorithms. We analyze, validate and deliver high accuracy field-level results.
We began with detecting corn, cotton, canola and sunflower fields, starting from our home country, Turkey.
Shortcomings of Current Field Estimations
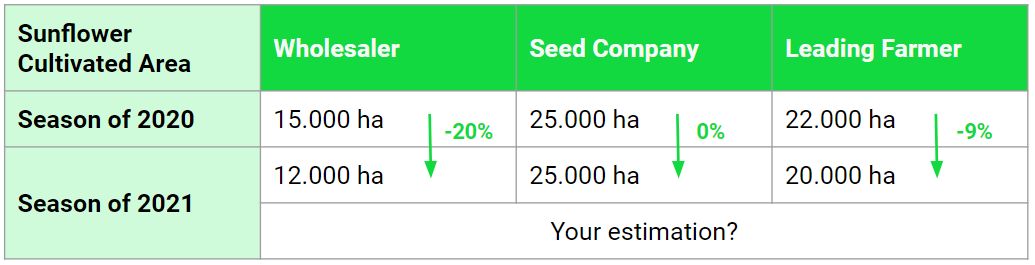
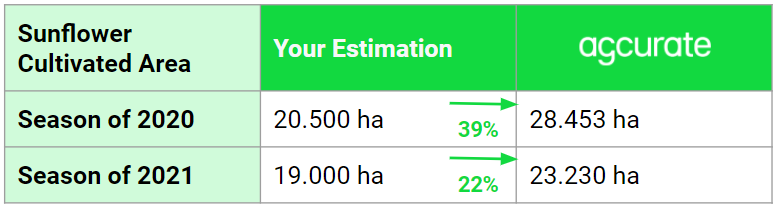
Imagine you are about to get some regional insights from your distributors, your wholesalers or other local sources on cultivated areas, mid-season. You get some messy inputs, ranging wildly and you are trying to come up with an accurate estimation. Similar to the numbers given below.

One potential way of using the inputs, is to compare inputs from different sources and measure year-over-year change in percentage. On the other hand, subjective inputs still hold you back. This might be due to any limitations that these sources have: They might have bias in favor of their understanding of the market, they might be missing some key trends and changes or there might be many exceptions. As a result, the compound effect of the limitations can change these numbers significantly.
Under these circumstances, you might assume that the average of your inputs form your baseline, your initial estimation. You might also decide to update these numbers any time through the season, if you get any doubts or if you get any major news.
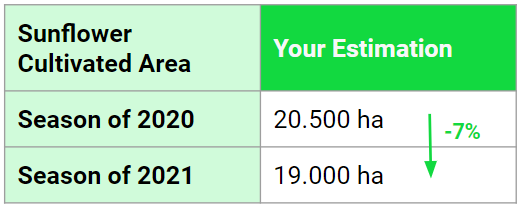
Although this is pretty much the current methodology of crop supply estimation, this methodology leaves you vulnerable to stark changes, manipulations and volatility.
Knowing the Fields Matters. The More, the Better.
Nowadays, another way to estimate crop cultivated area is possible via satellite imagery analysis. Agcurate offers accurate crop cultivated area statistics which has the potential to boost your operations.
On the other hand, switching to a completely new methodology might not work as expected. This could happen due to the way that agribusinesses are used to form a consensus around data that has shortcomings: which might be limited, outdated, erroneous or partially inaccessible. And there are different underlying principles to estimations based on satellite imagery analysis and physically observing the fields. In this case, even having 100% accurate crop classification information might not be enough to have the impact we desire without a quick and easy adoption.
The good news is, there’s a relevant solution: Having multi-year crop classification data. By analyzing the trends with multi-year crop classification results, you can much easily adapt to a new and better way of managing operations with reliable data and analytics.
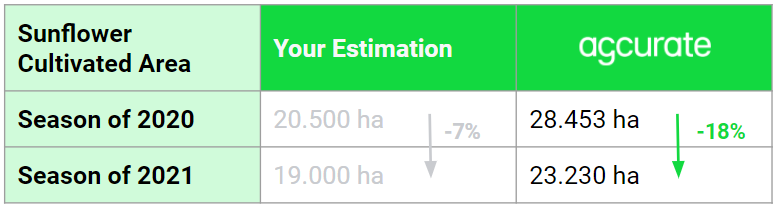
With multi-year data, there are two dimensions that you can investigate:
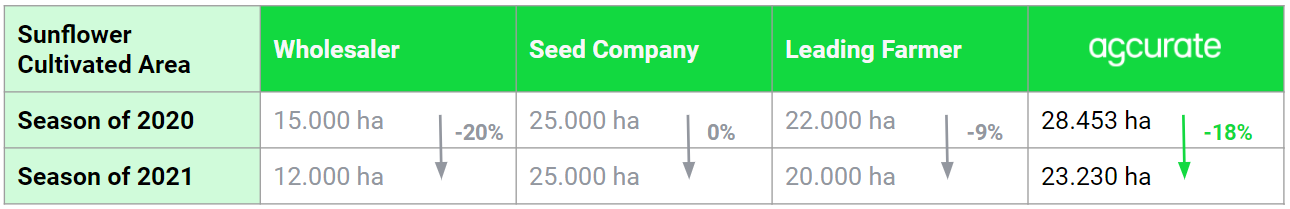
One is the mismatch between your cultivated area estimations and the results of Agcurate. The data is valuable for ideal crop valuation, detecting surplus or shortages in the market and getting where the supply demand can match.
Another dimension is the mismatch between trend analysis. This data is not only valuable for the current season but it can also give an early insight into where the market is going for the seasons ahead.
Now Offering: Multi Year Crop Classification
We believe that is a major pain point. As a result, we decided to go for it. Now, we are offering multi year crop classification for any crops we serve. As a result you will be able to:
- Compare cultivation between different years
- Detect trends through the years
- Position yourself earlier
- Position yourself better against the other market predictions
- Recognize differences between what’s planted across the fields and what other players in the market see
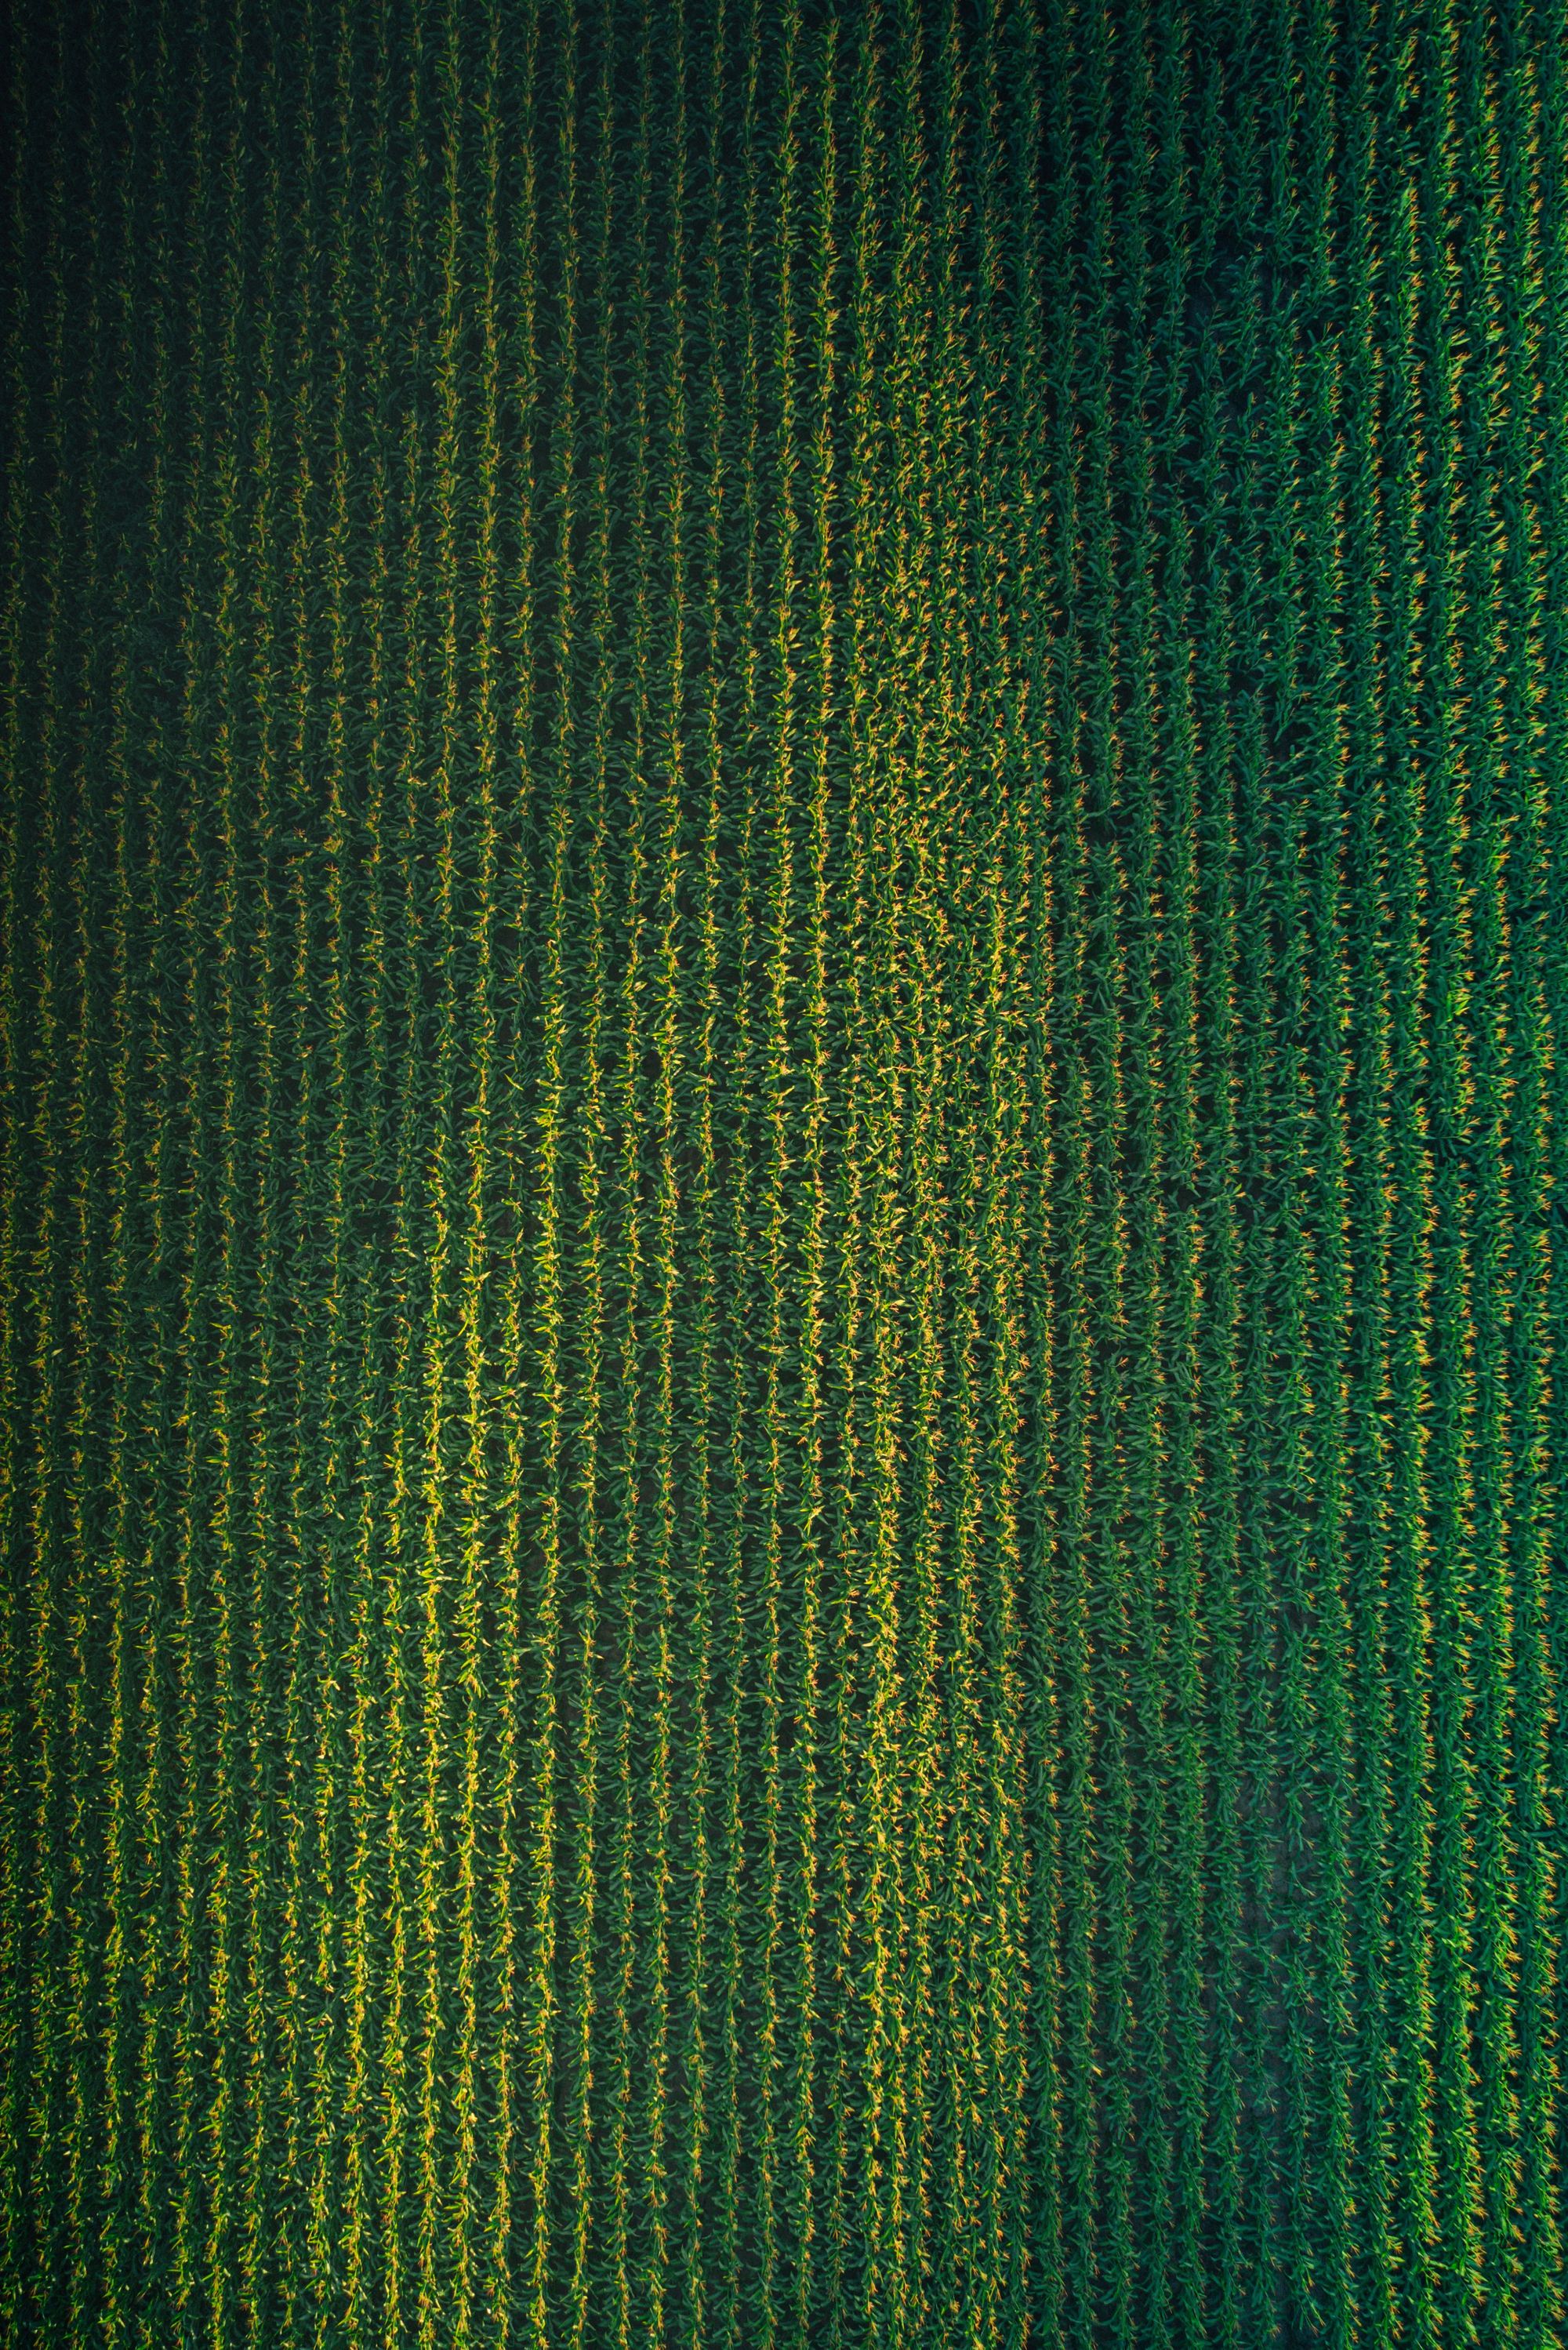
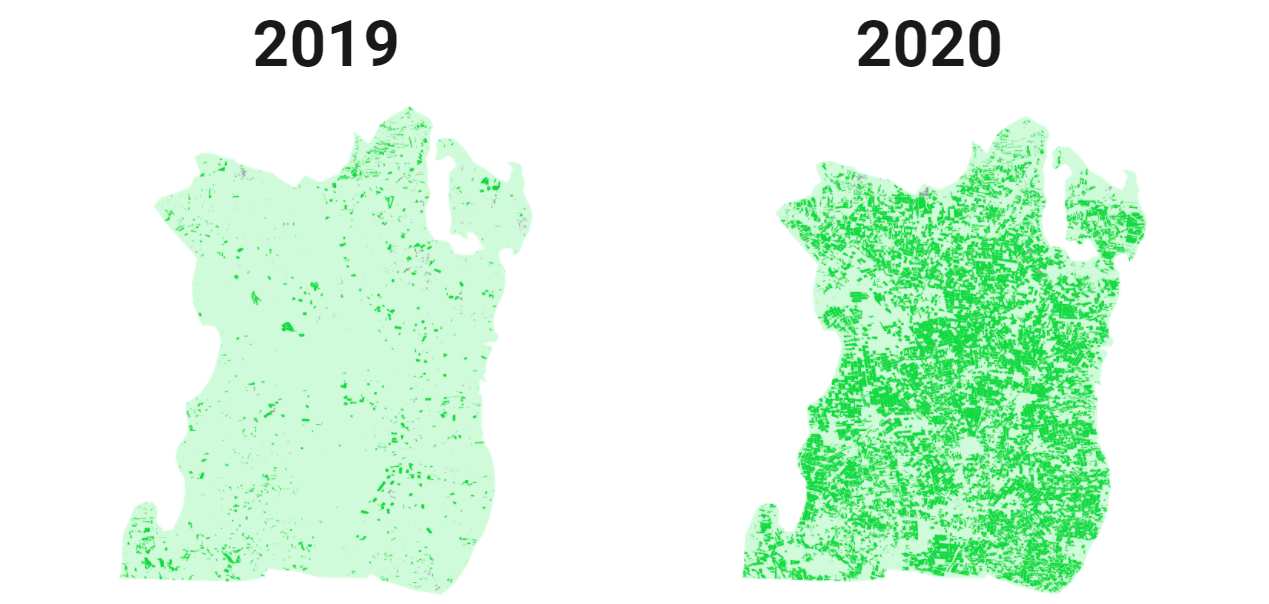
This understanding might have a major effect on the success of your business. Take the example of corn cultivated fields at Harran plains, Turkey. The corn fields are indicated with dark green and dark gray while the plains are indicated with soft green. On the left, you can see the year of 2019 and the year of 2020 is on the right.
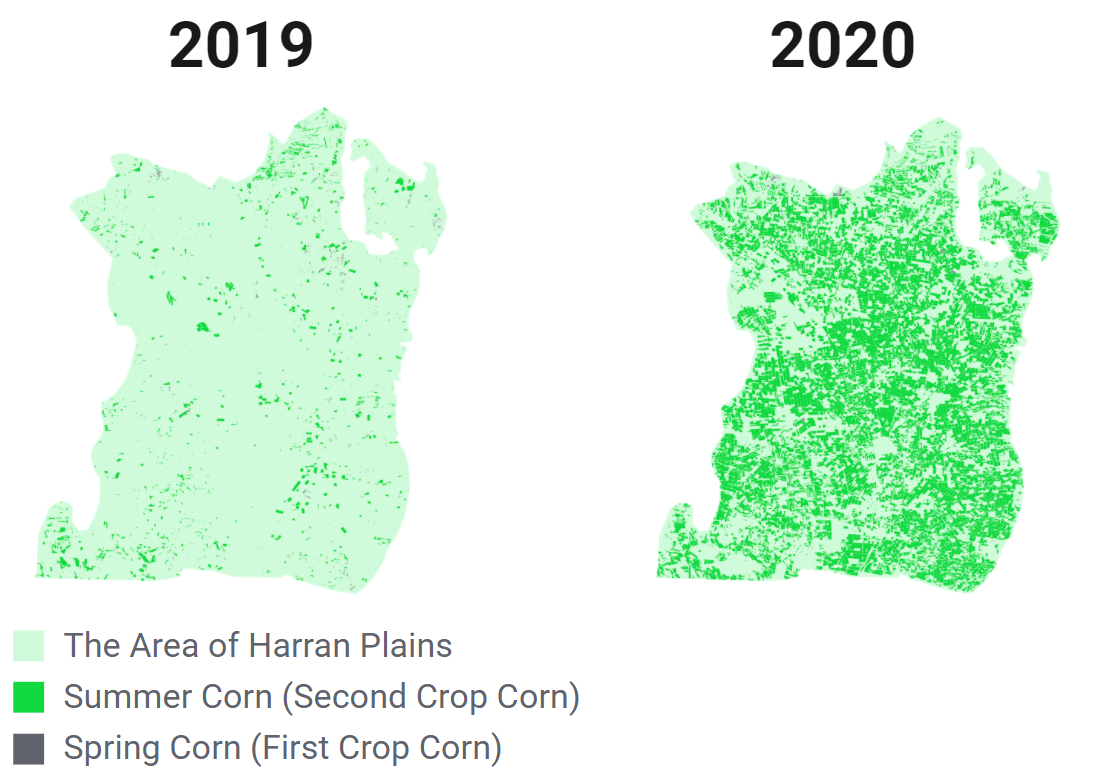
This much change is considered to be unusual and does not frequently happen in every plain, for sure. But even the slightest changes can affect, at least, operational profitability. Hence, with accurate multi-year trend data of Agcurate, you can always be sure and be prepared.
What’s Next?
In short, a lot! We will have major news related to yield and harvest + we will be in many major markets in the upcoming months, if not weeks! 😎
We will be working tirelessly to connect remote agri-intelligence with agribusiness. If you’d like to hear more from us, please subscribe to our newsletter below.
We can serve the seasons of 2020, 2019, 2018 and 2017, immediately. We already started offering demos including multi year crop classification. Do you need more details? On any crops, countries or years. We will be happy to talk. Just contact us via info@agcurate.com